In the modern development ecosystem, background job processing plays a vital role in ensuring seamless user experiences and scalable system architecture. BullMQ, a robust Redis-based job queue library for Node.js, is widely adopted for managing asynchronous tasks like email dispatching, image processing, video transcoding, and scheduled operations. As applications grow in complexity, so does the need for understanding what’s happening behind the scenes. This is where Redis queue dashboard becomes critical — offering visibility, traceability, and control over job queues and execution behavior.
What is BullMQ Observability?
BullMQ observability refers to the tools, techniques, and practices that allow developers and operations teams to monitor, measure, and debug the performance and behavior of BullMQ-powered job queues. It encompasses real-time job tracking, metrics collection, error detection, system performance, and end-to-end job lifecycle visibility.
Rather than waiting for failure signals or user complaints, observability empowers teams to proactively detect anomalies, understand system state, and make informed decisions. It's not just about "monitoring" — it's about making the system understandable and actionable.
Why is BullMQ Observability Important?
Early Detection of Issues
Without observability, failed jobs, processing delays, or queue bottlenecks may go unnoticed until they cause user-facing problems. With BullMQ observability, teams can identify issues before they escalate.Operational Confidence
Visibility into job queues gives developers confidence that background tasks are executing as expected. This is essential in high-availability systems where silent failures can lead to data loss or poor UX.Performance Optimization
Observability provides data on job durations, worker throughput, queue size, and retry rates — allowing you to identify and resolve performance bottlenecks.Debugging and Root Cause Analysis
When a job fails or behaves unexpectedly, observability tools provide logs, stack traces, and execution history to quickly pinpoint the problem.Scalability Planning
Tracking trends in queue growth, job volume, and worker efficiency supports better resource planning and infrastructure scaling.
Key Components of BullMQ Observability
To achieve comprehensive BullMQ observability, several pillars must be in place:
1. Job State Tracking
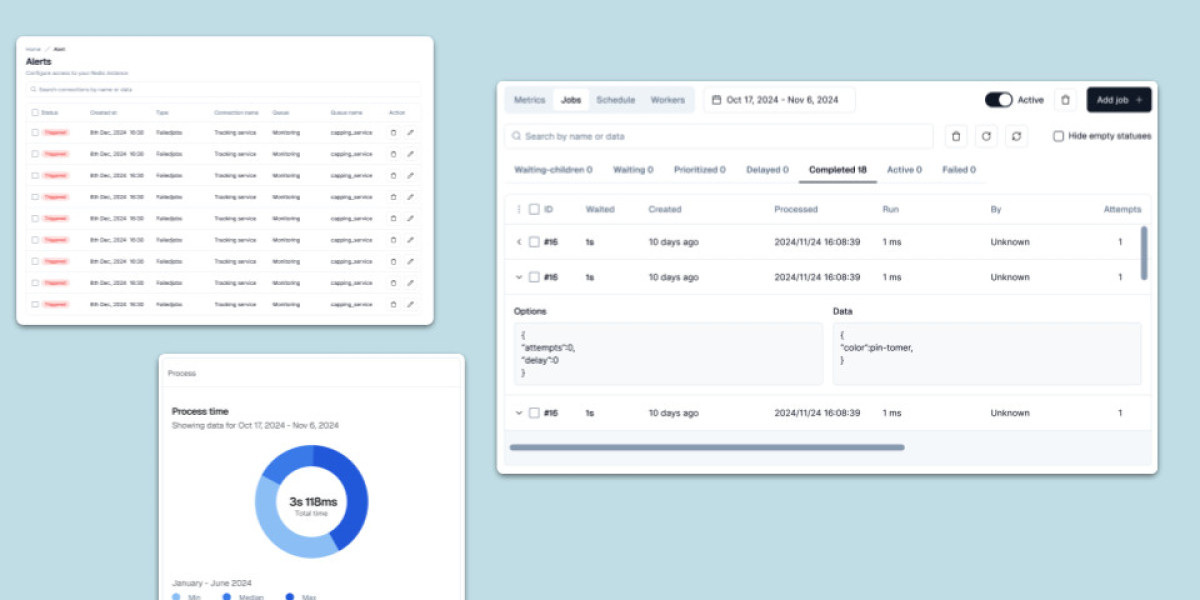
Each job in BullMQ passes through defined states — waiting, active, completed, failed, delayed, or stalled. Monitoring these transitions in real-time allows you to detect processing bottlenecks and failure spikes.
2. Event Monitoring
BullMQ emits a variety of events (completed, failed, progress, error, stalled) that can be captured and logged. Observing these events gives you a detailed timeline of job lifecycles.
3. Logging
Structured and centralized logging is essential. Log job creation, processing events, errors, and retry attempts. Tools like Winston, Pino, or Bunyan can be used to integrate logs with platforms like Logstash, Fluentd, or Loki.
4. Metrics and Dashboards
BullMQ does not ship with built-in metrics collection, but it integrates well with tools like Prometheus and Grafana. By instrumenting job processors, you can expose metrics like:
Queue size
Job latency
Job success/failure rates
Worker concurrency and load
Redis latency and memory usage
These metrics can be visualized on dashboards to get a bird’s-eye view of the system.
5. Distributed Tracing
In complex systems with microservices, a job may trigger multiple downstream services. Observability solutions like OpenTelemetry or Jaeger can help trace the full journey of a job, revealing performance bottlenecks and service dependencies.
6. Alerting
Integrating your observability stack with alerting tools (PagerDuty, Opsgenie, Slack, or custom webhooks) allows you to be notified instantly when job failures spike, queues grow beyond thresholds, or workers stall.
Tools Supporting BullMQ Observability
Several tools and libraries enhance BullMQ’s observability:
Bull Board and BullMQ UI: Web-based dashboards for real-time job monitoring, inspection, retry, and manual control.
Prometheus + Grafana: For time-series data monitoring and visualization.
ELK Stack (Elasticsearch, Logstash, Kibana): Ideal for centralized logging and search.
Datadog / New Relic / Sentry: Full-featured observability platforms that can integrate with BullMQ for logs, traces, and performance alerts.
OpenTelemetry: Offers tracing and metrics collection for distributed systems using BullMQ.
Best Practices for Effective BullMQ Observability
Instrument Jobs Thoroughly: Add custom metadata and progress logs to each job to aid in monitoring and debugging.
Isolate Queue Metrics: Use labels or namespaces for each queue to simplify metric aggregation and alerting.
Monitor Redis Health: Since BullMQ is tightly coupled with Redis, monitor Redis CPU, memory, connection count, and latency as part of your observability strategy.
Leverage Tags and Custom IDs: Assign identifiers to jobs for easier tracking in dashboards and logs.
Automate Cleanup and Retention: Configure job retention policies to avoid bloating Redis with outdated job data.
Conclusion
BullMQ observability is not just a luxury — it's a necessity for running reliable, performant, and maintainable asynchronous systems. As background tasks increasingly power essential application logic, understanding and monitoring the behavior of your job queues becomes mission-critical. With the right observability tools in place, development and operations teams can work confidently, resolve issues quickly, and scale systems effectively — all while ensuring that background processing remains seamless and resilient.